30 Project Management
Prerequisites: none. This chapter stands on its own.
See also: Chapter 31, Chapter 32, Chapter 3, Chapter 27.
Purpose
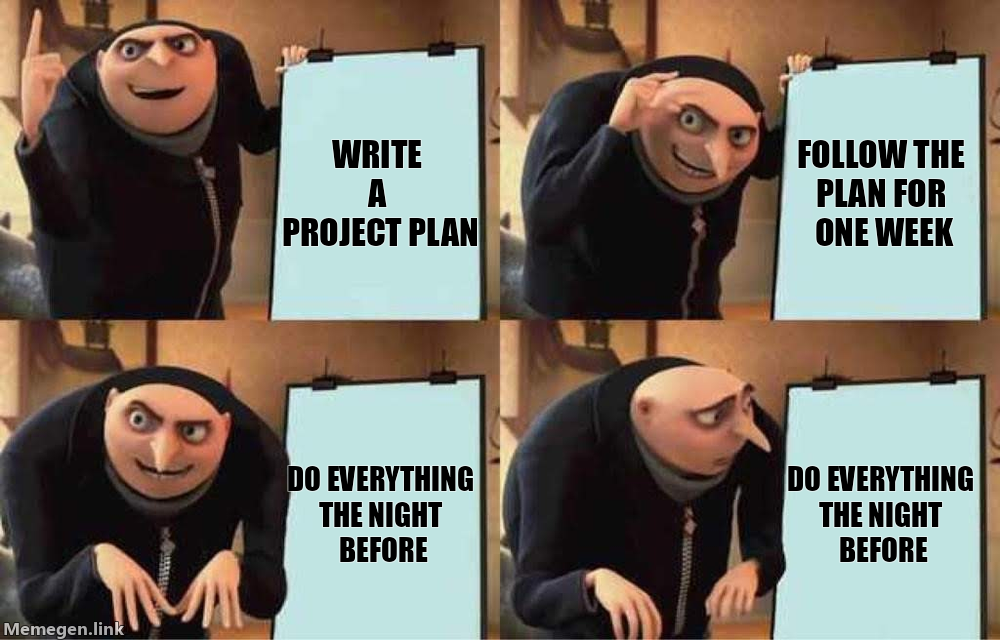
It’s the night before your group’s final project is due. The figures are in the slide deck, but nobody can say which notebook made them. The cleaned data is on one teammate’s laptop, and she’s on a plane. Two weeks ago someone changed how missing prices were handled, and the only record is a group-chat message four hundred messages up. The code is fine. The project is a mess.
If that sounds familiar, you’re in good company. Most student projects that go wrong go wrong this way, for reasons that have little to do with code: scattered files, a blurry goal, data nobody can trace, and decisions buried in private messages. The cure, project management, sounds like Gantt charts and status meetings, but for a small data project it’s much lighter: a one-page plan, a folder layout with an obvious home for every file, a few notes about the data, a README a stranger can follow, and a shared list of what needs doing.
This chapter covers those habits, from a project’s first day to the check you run before handing it in, and its worked examples follow one small project, coffee-sales, through them. It doesn’t teach Git (Chapter 31), code review (Chapter 32), or automation (Chapter 33), but it shows where each fits.
Why read this chapter
- You opened a project folder after spring break and found
analysis.ipynb,analysis_v2.ipynb, andanalysis_FINAL_real.ipynb, and you honestly don’t know which one made the figures you submitted. - Your group project runs on a group chat, and every week someone asks “wait, who was doing the cleaning?” or “didn’t we already decide that?”
- Your TA tried to rerun your project and got
FileNotFoundErrorfor/Users/yourname/Desktop/data.csv, a path that exists only on your laptop. - A new month of data arrived, your pipeline ran without a single error, and the numbers came out quietly wrong because the vendor had renamed a column.
- Someone asked why your cleaned file has 4% fewer rows than the raw one, and you couldn’t remember whether that was a decision or a bug.
- You want a README a stranger can follow, and a way to prove, the day before the deadline, that your project runs on a computer other than yours.
- You keep hearing “open an issue,” “milestone,” and “definition of done,” and you’d like to know what they look like on a project with three people and six weeks.
Running theme: make progress visible and work repeatable
A well-run project lets anyone, including you three months from now, see what the data are, what changed, what’s left to do, and how to rerun everything.
30.1 A project is more than its code
When a project falls apart, the code is rarely what broke; it’s everything around the code. A project is really five kinds of things that have to stay consistent with each other. The data: raw inputs, processed outputs, and the files in between. The code: scripts, importable modules, and notebooks. The environment: the Python and package versions and other assumptions that make the code run. The documentation: what the project is for, the decisions you made, how to run it, and how to read the results. And the work tracking: the tasks, bugs, questions, and priorities that tell your team what’s happening and what’s next. Each needs a stable home, and a project that ignores any one of them pays for it eventually.
Projects also move through four phases. You plan what success looks like, build the pipeline and analysis, verify quality by reproducing the outputs from a clean start, and deliver the results with their limitations stated. The phases overlap, but skipping one tends to sink the project at exactly that point: skip planning and you produce results nobody asked for, skip verification and you ship wrong numbers, skip delivery and the work is done but never used. The goal throughout is reproducibility in its everyday sense: someone else, or future you, can get the same results from your files without asking you anything.
30.2 Planning, without the bureaucracy
Planning sounds like something for managers with calendars. For a course project it’s an hour, and it’s the hour that saves the most time later.
The one-page project brief
Before you write any code, write a brief that fits on one page; the limit is the point, because it forces you to decide what matters. It answers six questions. What’s the problem, in one paragraph: what are you trying to find out, fix, or build? Who’s the audience, and what will they do with the result? What are the deliverables, the concrete things that will exist when you’re done (tables, figures, a memo, a dashboard, a model, a slide deck)? What are the success criteria: how will you know you’re done? What are the constraints: time, computing power, data access, privacy rules? And what are the risks: which assumptions might be wrong, which data sources might fail, which definitions might shift?
# Q3 Sales Trend Analysis

**Problem.** Identify which product categories drove revenue growth in Q3.

**Audience.** Brian (instructor), as part of INFO-3010 final project.

**Deliverables.**
- A 3-page memo summarizing findings.
- Two figures: monthly revenue by category, top-10 SKUs.
- A data dictionary for the cleaned table.

**Success criteria.** Findings reproduce end-to-end from raw data with
one command. Figures and tables are explicitly cited in the memo.

**Constraints.** Two weeks. Local laptop. Public dataset only.

**Risks.** Category labels may change between months. Some prices missing.
That’s the whole thing, and it answers most of what a grader, a teammate, or future you will ask. When the project starts growing sideways (scope creep), “is this in the brief?” is the cheapest defense. The Turing Way’s chapter on project design goes further for bigger projects.
Break the work into milestones
A brief tells you where you’re going; milestones tell you whether you’re on the way. A milestone is a chunk of work big enough to mean something and small enough to finish in a week or two. Professionals break big projects down in a formal work breakdown structure; you need only the lightest form of it. Four milestones suit most course projects (fewer than three leaves too much vague, and more than six feels like paperwork), and this pattern fits most data analyses:
- Data acquisition and intake note. Get the data, record where it came from, and describe what you received. Done means “I have the raw data on disk and can explain where it came from.”
- Cleaning and data dictionary. Turn the raw data into a clean, documented dataset. Done means “every column has the right type, missing values are handled on purpose, and a data dictionary explains what each column means.”
- Analysis and validation. Answer the questions in the brief and check that the answers are plausible. Done means “I have an answer to each question and at least one sanity check on each result.”
- Outputs, write-up, and reproducibility check. Produce the deliverables and confirm they rebuild from scratch. Done means “someone else could
git clonethis repository, run one command, and get the same outputs.”
Each milestone collects a handful of tasks, and when they’re all finished, the milestone is done. A short list in your README is enough to start; “Issues: the project’s shared memory” below shows how to move it into GitHub when the list gets long.
Expect decisions, and decide where they’ll live
Every analysis has a handful of decisions that change the results: how to handle missing values, which records to filter out, which join key to trust, which time window to include. The trouble is that they feel small when you make them. “Oh, you dropped the rows with no timestamp? Fine. Wait, how many rows was that?”
So before the analysis starts, list the decisions you can see coming and agree where each kind will be written down: an issue, a DECISIONS.md file, or the notebook beside the code (“A decision log” below compares them). The case to avoid is no record at all, where three months later you can’t explain why sales_clean.csv has 4% fewer rows than sales_raw.csv, or whether that was on purpose.
30.3 A folder layout that gives every file a home
Most “where did I put that?” moments come from a project that grew without a plan. Pick a layout on day one, before the project can sprawl, and every new file has an obvious home.
Five rules the layout follows
A good layout follows five rules that sound obvious and that you’ll be tempted to break every week.
One project, one folder. Everything the project needs (code, data, documentation, settings, outputs) lives inside one top-level folder, not on your Desktop or a shared drive somewhere else. Share that folder, and the other person has everything.
Raw data is read-only. What you downloaded or were given lives in data/raw/ and is never changed in place. Errors get fixed by cleaning code that writes to data/processed/, so the raw file is always exactly what arrived, not “what arrived plus three years of fixes nobody remembers.” Cookiecutter Data Science, whose layout this chapter borrows, puts it bluntly: “Don’t ever edit your raw data. Especially not manually. And especially not in Excel.”
Outputs come from code. Every figure, table, and number in the report should be regenerated by a documented command. Nudge a plot by hand in PowerPoint, or type a number into a spreadsheet without its formula, and the project stops being reproducible right there.
Paths are relative to the project root. Code refers to data/raw/sales.csv, not /Users/yourname/Desktop/sales/data.csv. An absolute path works only on the computer where it was written, which makes it one of the most common reasons a TA can’t run a student’s project. (For a script that has to find the project root no matter where it’s run from, see Chapter 17.)
Each kind of thing has its own place. Data in data/, code in src/, notebooks in notebooks/, outputs in reports/, documentation in docs/ or the README, so you never wonder where a script went.
A template to copy
This layout works for most course and small research projects. Copy it, and add folders only when you have a real reason:
project/
├── README.md              # how to set up, run, and interpret
├── requirements.txt       # (or environment.yml) pinned dependencies
├── .gitignore             # which files NOT to commit
├── Makefile               # one-command entry points
├── pyproject.toml         # optional: makes a package in src/ installable
│
├── data/
│   ├── raw/               # original, immutable source data
│   ├── processed/         # cleaned data, ready for analysis
│   └── external/          # reference data from outside sources
│
├── notebooks/             # exploratory and narrative notebooks
├── src/                   # your Python code
├── scripts/               # optional: entry points that import your package
│
├── reports/               # generated reports (HTML, PDF, memos)
│   └── figures/           # figures referenced by reports
│
├── docs/                  # extended project documentation
└── tests/                 # optional: unit and smoke tests
It’s a simplified version of the Cookiecutter Data Science template. It isn’t the only sensible layout, but a conventional one means anyone who has seen a project like it can find their way around yours. The Makefile lets one command such as make run rebuild everything; Chapter 33 shows how to write one.
Names that sort and survive
Files named Final.csv, final (1).csv, and data FINAL use this.csv are the classic sign of a project that lost track of itself. A few naming rules prevent it; consistency matters more than which rules you pick, so decide once and write it in the README.
Use lowercase, with hyphens or underscores, not both. Pick sales_q3_2026.csv or sales-q3-2026.csv and stick with it. Capitals are a quiet cross-platform trap because of case sensitivity: macOS and Windows treat Data.csv and data.csv as the same file by default and Linux doesn’t, so code that reads Data.csv can work on your Mac and fail on the Linux server your TA grades on.
Put dates in ISO 8601 form, 2026-04-10, not 10-04-26 or apr-10. ISO dates are unambiguous everywhere, and they sort alphabetically into the order they happened.
Avoid spaces and names that promise things. Spaces make every terminal command need quotes. And if you catch yourself adding final, v2, or USE_THIS to a name, stop: what you want is version control (Chapter 31) or a dated snapshot, not an increasingly desperate filename.
What goes where, and what stays out
The short version: raw data is never edited, processed data is always generated, code lives in src/, and outputs go in reports/.
data/raw/ holds source files exactly as you received them, and nothing in it is ever edited, by you or your code. data/external/ is the same for reference data that supplements your main dataset, such as country codes, a census crosswalk, or a list of holidays. data/processed/ is the opposite: your code makes everything in it, so if you delete the folder, make run (or your equivalent) should rebuild it.
notebooks/ holds the notebooks where you explore and tell the story; Chapter 16 has the habits that keep them tidy. src/ holds your Python code. In a small project that can be a couple of scripts you run directly, like python src/clean.py in the worked examples. Once several scripts or notebooks need the same functions, make src/ a package (src/yourpackage/), install it once with pip install -e ., and put the entry points in scripts/; Chapter 17 shows how. It also explains a trap you’ll probably hit first: python scripts/run_analysis.py can’t do from src.cleaning import ..., even from the project root (ModuleNotFoundError: No module named 'src'), because Python looks for imports in the script’s own folder. Installing the package fixes it.
reports/ holds the finished products: a report, a memo, figures. Committing them lets collaborators see results without running anything, and lets git diff show whether a rebuild changed them; ignoring them keeps the repository small. Either is fine if the README says which (coffee-sales ignores them).
Some things never belong in the repository: passwords, API keys, tokens, and private keys (Chapter 34 says where they go); data files over a few megabytes, which belong in external storage; and personal information you don’t have permission to share. A .gitignore file keeps them from being committed by accident: list .env, *.key, .venv/, data/processed/, and data/raw/ too if the raw data is sensitive.
30.4 Looking after your data
Code you can rewrite. Data you received once, from someone, under some terms, and if you lose track of that, no code will get it back. Each habit here takes a few minutes.
Provenance: where did this data come from?
Before you do anything else with a dataset, write down four things: where it came from (a URL, a file path, an API endpoint), when you got it, its license or terms of use, and any access restrictions or privacy concerns. That record is its provenance, the first link in its data lineage. Put it in a provenance.md beside the data or in the README, the moment you download the file; in three weeks you won’t remember.
# data/raw/sales/

source:    https://example.org/datasets/q3-2026-sales.csv
retrieved: 2026-04-10 10:14
license:   CC-BY 4.0
notes:     Public release; no PII. Column "rep_id" is a hashed identifier.
Then treat the raw file as evidence. Even an obvious error, like a typo in a header, gets fixed in cleaning code, where anyone can see what changed and why, never in the file itself.
Data dictionary and codebook
Six months from now you’ll open this project and have no idea what qty_alt2 means. A data dictionary is the fix: a small table that lists each column’s name, its type (number, text, date, category), what it means in plain words, its units, the values it’s allowed to take, and how missing values are marked (-999, "unknown", a blank). The term comes from databases, where a data dictionary records what every field means and what format it’s in. It’s what makes a dataset usable by anyone but its maker. Record your transformations (derived columns, recodes, joins) the same way.
Keep it as a file beside the data, in a format code can read. A CSV with one row per column is enough. Here is data/dictionary.csv for a small sales export, data/raw/sales-2026-04-10.csv, the same file the worked examples use. Each row describes one column, and a list of allowed values is separated by |:
column,type,description,units,allowed,missing
date,date,Day of the sale (store's local time),,,never
store,text,Store where the sale was rung up,,north|south|campus,never
product,text,Product category,,coffee|tea|pastry|sandwich|juice,never
quantity,integer,Items in the sale,items,1 or more,never
revenue,number,Amount paid after discounts,US dollars,0 or more,never
note,text,Discount code applied at the register,,promo|loyalty,blank means none
Draft it from the data, then write what only a person knows. pandas can list each column’s name, type, missing count, and an example value in a few lines. The script writes to a separate draft file, so running it again can’t erase the descriptions you’ve written by hand:
import pandas as pd

df = pd.read_csv("data/raw/sales-2026-04-10.csv", parse_dates=["date"])

draft = pd.DataFrame({
    "column": df.columns,
    "type": df.dtypes.astype(str).values,
    "missing": df.isna().sum().values,
    "distinct": df.nunique().values,
    "example": [df[c].dropna().iloc[0] if df[c].notna().any() else "" for c in df.columns],
})
draft["description"] = ""
draft["units"] = ""
draft["allowed"] = ""
draft.to_csv("data/dictionary-draft.csv", index=False)
print(draft.to_string(index=False))
column type missing distinct example description units allowed
date datetime64[us] 0 3 2026-04-01 00:00:00
store str 0 3 north
product str 0 5 coffee
quantity float64 1 3 2.0
revenue float64 0 8 7.5
note str 7 2 promoThe draft already caught something: quantity should be whole numbers, but pandas read it as float64 (example 2.0), because one value is missing, and pandas marks a missing number with NaN, which only a decimal column can hold. Still, the draft is the easy half. No code can tell you that revenue is after discounts, that dates are in the store’s local time, or that a blank note means “no discount” rather than “unknown.” Fill in the empty columns by hand, from the source’s documentation or by asking whoever produced the data, swap pandas’ type names for plain words (date, text, integer, number) that don’t change between pandas versions, and save it as data/dictionary.csv.
A codebook is the survey-research version. It adds the exact wording of each question, what each response code means (1 = “strongly disagree”), and who was asked (the respondents a skip pattern sent to the question). With survey data, look for the codebook first; if you’re collecting survey data, write one.
Let the dictionary check the data. A dictionary that code can read can also catch data that has stopped matching it. This short script compares a file’s columns with the dictionary, checks that number columns really are numbers, and checks the values of any column whose allowed entry is a list separated by |:
import sys

import pandas as pd

dictionary = pd.read_csv("data/dictionary.csv", keep_default_na=False)
df = pd.read_csv(sys.argv[1])

problems = []
expected = list(dictionary["column"])
if list(df.columns) != expected:
    problems.append(f"columns: expected {expected}, got {list(df.columns)}")
for row in dictionary.itertuples():
    if row.column not in df.columns:
        continue
    col = df[row.column]
    if row.type in ("integer", "number") and not pd.api.types.is_numeric_dtype(col):
        problems.append(f"{row.column}: should be a {row.type}, but pandas read it as {col.dtype}")
    if "|" in row.allowed:
        unexpected = set(col.dropna().astype(str)) - set(row.allowed.split("|"))
        if unexpected:
            problems.append(f"{row.column}: values not in the dictionary: {sorted(unexpected)}")

if problems:
    sys.exit("Data doesn't match data/dictionary.csv:\n  " + "\n  ".join(problems))
print("Data matches data/dictionary.csv")
Saved as check_data.py, it passes the April export. (It doesn’t read the missing column, so it lets the April file’s blank quantity through; the quality report in the worked examples is what catches that.) The May export looks the same at a glance, but the check finds three changes:
$ python check_data.py data/raw/sales-2026-05-10.csv
Data doesn't match data/dictionary.csv:
  columns: expected ['date', 'store', 'product', 'quantity', 'revenue', 'note'], got ['date', 'store', 'product', 'quantity', 'revenue', 'notes']
  product: values not in the dictionary: ['cold brew']
  revenue: should be a number, but pandas read it as str
The vendor renamed a column, the stores started selling cold brew, and one row’s revenue has a $ in it. Each would have gone through a pipeline without an error and changed its results, so run the check first in your pipeline (see “Silent data drift” below). When you outgrow a script like this, the same idea comes in libraries such as pandera (see Chapter 21), and in Table Schema, a standard JSON format for a data dictionary that tools in several languages can read.
Versioning data
When a new export or a corrected release arrives, don’t overwrite the old file. Save the new one as a dated snapshot (sales-2026-05-10.csv) beside it, and write down what changed. Record a checksum too, a short fingerprint computed from the file’s bytes: if even one byte changes later, the fingerprint won’t match. sha256sum records one and checks it later:
# Record a checksum at intake
sha256sum data/raw/sales-2026-04-10.csv >> data/raw/checksums.txt

# Later: verify the file is still what you think it is
sha256sum -c data/raw/checksums.txt
On macOS, shasum -a 256 does the same job, -c included; in Windows PowerShell, Get-FileHash prints the hash for you to compare. For the “what changed” part, a data/raw/CHANGELOG.md with one short entry per snapshot is plenty.
When the dictionary check fails on a new snapshot, decide for each change whether the data or the dictionary should give way. A $ in a number column is for your cleaning code to fix; a new product is a fact the dictionary should learn. Change the dictionary in the same commit as the code that handles the change, and add a changelog entry:
## 2026-05-10 export
- `note` is now called `notes`; clean.py renames it back.
- New product `cold brew`; added to the dictionary's allowed values.
- One `revenue` value has a `$`; clean.py strips it before converting.
Because the dictionary is a file in your repository, its history is your schema’s history: git log -p data/dictionary.csv shows every change to it, with the date and the commit message that explains why (see Chapter 31, or the git log reference for more options).
Sensitive data
If the data might contain personal information, treat it as sensitive from the moment it lands. List the columns that identify people (names, emails, phone numbers, addresses, student IDs), and keep access to as few people as possible. Sensitive data often shouldn’t live in the repository at all, even in an ignored folder: one careless git add -A or mistyped .gitignore line commits it, and once it’s pushed, copies may exist that you can’t delete. Before you share even aggregate results, check that nobody can be picked out through a small group or an unusual combination of attributes; re-identification from “anonymous” data is easier than it sounds. A leak can’t be undone, and a little paranoia costs almost nothing.
30.5 Documentation that makes a project runnable
Chapter 3 covers documentation in general. This section is about the few documents that let someone who didn’t write your project run it and understand what it found.
The README comes first
The README.md at the root of your project is the first thing anyone looks at, and often the only thing. Write it for someone trying to get your code running on their laptop in the next twenty minutes (you in six months, a TA, a teammate joining late). They need five things.
What the project does, in one short paragraph of plain English: the question it answers, who it’s for, and what it produces. Not a literature review, a pitch. “This project analyzes Q3 2026 sales data to identify which product categories drove revenue growth, producing a 3-page memo and two figures for INFO-3010.”
What data it needs, and where it goes: each dataset, its source (pointing to the provenance notes), and the exact path the code expects. If the data isn’t in the repository, say how to get it.
How to set up the environment, as commands to copy and paste: create a virtual environment with venv and install the pinned requirements (Chapter 15 explains the pieces).
One command that reproduces the main outputs, ideally a Makefile target such as make run, which a reader can find and run without reading anything else.
How to read the outputs: what they’ll find after make run, and where. That’s the map from “I ran it” to “I understand what I’m looking at.”
# Q3 Sales Trend Analysis

Analyzes Q3 2026 sales to identify which product categories drove revenue
growth. Final deliverable is a 3-page memo with two supporting figures.

## Data

- `data/raw/sales-q3-2026.csv` — public release from example.org,
  retrieved 2026-04-10. See `data/raw/provenance.md`.

## Setup

    python -m venv .venv
    source .venv/bin/activate
    pip install -r requirements.txt

## Run

    make run              # rebuilds cleaned data and report
    make clean run        # rebuilds everything from scratch

## Outputs

- `reports/q3-memo.pdf` — the memo
- `reports/figures/revenue-by-category.png` — Figure 1
- `reports/figures/top-10-skus.png`          — Figure 2
- `data/processed/sales.parquet`             — cleaned data
Short matters more than it seems: an out-of-date README lies to people, and short ones are the ones that get kept up to date.
A decision log
“We dropped rows with no timestamp.” “We used a left join on customer_id, not an inner join.” “We capped values beyond three standard deviations instead of dropping them” (a form of winsorizing). Each changes the results, and anyone reading them needs to know. A decision log records these choices as they’re made. The format matters much less than the log existing and being searchable, and there are three good places for one.
In an issue, when a decision needs discussion or a teammate’s agreement. Title it with the question (“How should we handle missing timestamps?”), lay out the options, and close it with the choice and the reason, so the options you turned down are on record too.
In a DECISIONS.md file at the project root, for decisions that reach across several files or stages. One dated entry per decision:
# Decisions log

## 2026-04-08 — Missing timestamps
**Context.** 3.2% of rows in the raw data have null `transaction_timestamp`.
**Decision.** Drop these rows during cleaning; they are concentrated in a
single store ID that had a logging outage, and imputing them would bias
our time-series results.
**Impact.** Row count drops from 124,531 to 120,522.

## 2026-04-09 — Category labels
**Context.** The `category` column uses inconsistent casing ("electronics",
"Electronics", "ELECTRONICS").
**Decision.** Normalize to title case during cleaning.
**Impact.** 14 category values collapse to 9.
In the notebook, in a Markdown cell beside the code, for a decision that belongs to one analysis step.
Pick one home for each kind of decision and keep to it. The worst version is no log at all, and a strange result six weeks later that nobody can say was a choice or a bug.
Notes that keep it running next year
Three more notes separate “it runs” from “it runs on someone else’s computer next year.”
The environment file isn’t optional. A requirements.txt, environment.yml, pyproject.toml, or lockfile, committed, with versions pinned (Chapter 14). “Whatever was on my laptop” isn’t a list of dependencies, as the worked examples show when a package installed by hand goes missing.
Say what Python can’t install. If the project needs something from outside Python, such as poppler for reading PDFs, the README has to say so, because a requirements.txt can’t.
Include a small smoke test. A smoke test runs the whole pipeline on a tiny slice of data and checks for a known result (“does make smoke finish in under thirty seconds and produce twelve rows?”). It catches the common breakages (a missing dependency, the wrong Python version, a moved input file) before they eat an hour.
30.7 Quality gates: make “done” mean something
“I finished the analysis” is a feeling, and feelings are unreliable at 2 a.m. before a deadline. A quality gate turns “done” into a set of checks that pass or fail, so the claim survives you being tired, rushed, or overconfident.
The reproducibility check
The most valuable gate is one question: does the whole thing run, from nothing, in a fresh environment? That’s what separates “works on my machine” from reproducible. Run it before you hand in a project, and weekly while it’s active. Delete everything your code generated, throw away your virtual environment, then follow your own README from the top and check that the outputs come back:
# Fresh reproducibility check
make clean                    # delete processed data, reports, caches
rm -rf .venv/                 # throw away the environment entirely

# Start over from the README
python -m venv .venv
source .venv/bin/activate
pip install -r requirements.txt

# Run the pipeline
make run

# Compare the outputs to the last committed versions
git status                    # any unexpected changes?
git diff reports/ # do the regenerated reports match?(git diff reports/ helps only if you commit your reports; otherwise compare against a copy you kept.) In the best case, everything rebuilds and matches: the project is reproducible. In the middle case, something differs slightly, maybe a date stamped into a report or rows in a different order each run; fix it, or write down why it’s harmless. In the worst case the rebuild fails, which feels bad but is exactly the bug you wanted to find before someone else did. So run it the day before the deadline, not an hour before; the worked examples show a real run that found two problems.
Data checks
Each time you load a dataset, a few quick checks confirm it’s what you think it is, and catch “the data changed upstream” and “my cleaning quietly dropped half the rows”:
import pandas as pd

df = pd.read_parquet("data/processed/sales.parquet")

# Shape: how many rows and columns?
print(f"shape: {df.shape}")
assert df.shape[0] > 100_000, "too few rows; upstream data changed?"

# Missingness: are nulls where you expect them?
print(df.isna().sum())
assert df["price"].isna().sum() == 0, "price should never be null"

# Value ranges: are numbers in plausible bounds?
assert df["price"].between(0, 10_000).all(), "implausible price values"
assert df["transaction_date"].min() >= pd.Timestamp("2026-07-01")
# "before October 1" rather than "<= September 30", so sales late on Sept. 30 count
assert df["transaction_date"].max() < pd.Timestamp("2026-10-01")

# Key uniqueness: are the keys you expect to be unique actually unique?
assert df["transaction_id"].is_unique, "duplicate transaction IDs!"

# Join coverage: after a join, did every row find a match?
products = pd.read_parquet("data/processed/products.parquet")
joined = df.merge(products, on="sku", how="left", indicator=True)
assert (joined["_merge"] == "both").all(), "some sales have no matching product"
Each assert is a tripwire: when the data changes or your cleaning has a subtle bug, one fails loudly (AssertionError: some sales have no matching product) instead of letting bad data flow into the analysis. Chapter 21 has the fuller story.
Output checks
Your figures, tables, and report have gates of their own, the ones that stop “the axis doesn’t say what it measures” from reaching your instructor.
A figure should make sense on its own: an informative title (not “Figure 1”), axes labeled with units, a legend if there’s more than one series, and a caption that says what it shows and what point it makes. Tables need headers that explain themselves and consistent precision; report revenue to the dollar in one place and to the cent in another, and a careful reader starts doubting everything else. Put sources and caveats in footnotes.
And the write-up should be honest about what it doesn’t know. If you dropped 3% of the data while cleaning, say so and why. If your sample is biased in a known way, name the bias. If the effect is small or could be noise, say that too. Readers trust reports that admit their limits.
A short list to run through before you submit:
For each figure:
[ ] Title is informative (not "Figure 1")
[ ] Axes are labeled with units
[ ] Legend is present (if needed) and readable
[ ] Caption explains what the reader is looking at
[ ] The figure is regenerated by code, not hand-edited

For each table:
[ ] Column headers are self-explanatory
[ ] Numeric precision is consistent
[ ] Data sources and caveats are noted

For the narrative:
[ ] States what the data are and where they came from
[ ] Names the key assumptions and decisions
[ ] Acknowledges limitations and uncertainty
[ ] Explicitly cites every figure and table
30.8 When projects go wrong
Most project trouble comes in a few familiar shapes. None of them means you’re bad at this; they’re what happens by default when nobody decides otherwise. The shortcuts behind them pile up the way technical debt does in software, each saving a minute now and costing an hour later, so it pays to recognize them early.
Folder chaos and lost files
You can’t find the notebook from three weeks ago, six files have “final” in their names, and the dataset a teammate emailed you is on your Desktop because you didn’t know where else to put it. The prevention is the layout from earlier, set up on day one, and the habit of deciding where a file belongs before you save it.
If the project is already a mess, rescue it in two steps. First, create the proper structure and move files into it a few at a time, fixing the paths in your code as you go. Second, hunt down what’s lost with your file system’s search, by extension (*.csv), date modified, or part of the name. If an output is gone for good but you still have the script that made it, run the script again. That’s exactly why reproducible pipelines are worth the trouble: they make lost outputs recoverable.
Silent data drift
A pipeline that worked last week gives different answers today, and nobody changed the code. Or worse, it gives the same shape of output with wrong numbers, and nobody notices until the final report is embarrassing.
The prevention is to treat raw data as versioned snapshots, not a live feed, with provenance notes and checksums (“Versioning data” above). The detection is to check each new snapshot before you use it: run the dictionary check and the data checks above as the first step of the pipeline, and compare simple summaries (row counts, column types, the values in a category column) with the previous run. If the row count drops by 30%, a column changes type, or a column that held only 0 and 1 suddenly contains a 2, stop with an error. Drift caught the same day is a small annoyance; drift that rides along for three weeks is a question of whether anyone can trust your results.
Undocumented assumptions
“Why did we exclude store 14?” “No idea.” “Why is this threshold 0.3 and not 0.5?” “I don’t remember.” Every undocumented assumption is a trap set for future you. The test for what to write down is “if I switched this to the other reasonable option, would the numbers move?” If yes, record it in the decision log or a comment beside the code; if no, don’t bother. On a team, build it into review: an unexplained number or a filter that isn’t obviously right gets the reply “please explain this in a comment or the decision log.” The point isn’t paperwork; it’s that the next reader can follow the logic without guessing.
Work tracked in private channels
A decision was made in a direct message, and only two of the three teammates know. A bug was mentioned in the hallway, and only the person who heard it remembers. Private channels can’t be a project’s memory: nobody else can search them, they scroll away, and they leave out everyone who wasn’t there. They also make the project depend on particular people being around, what software teams half-jokingly call the bus factor.
The fix is to make the tracker the single place for “what needs doing” and “what we decided.” When a chat produces a task, someone opens an issue right away, with a link back to the conversation; when a meeting makes a decision, someone writes it up before everyone leaves. The rule is if it isn’t in the tracker, it doesn’t exist, and a team keeps to it if one person keeps gently reminding the others. In return, the project stops losing decisions and the team stops having the same argument twice.
30.9 Stakes and politics
Open your team’s issue tracker at the end of a semester project and look at who closed what. The teammate who wrote the cleaning script has fifteen closed issues with their name on them. The teammate who spent two afternoons on the phone with the café manager, finding out that the duplicate sale was real and what a blank note meant, has none, because that work never became an issue. Nobody meant to erase it. The tracker counts only what someone typed into it.
That’s the uneven visibility built into the practices in this chapter. Issues, definitions of done, and status updates make some work easy to see, and they make other work, such as mentoring, carefully reading a teammate’s draft, or building trust with a community partner, hard to see. That kind of invisible labor doesn’t fit in a board column, and a team that rewards only what’s visible ends up rewarding only some of its members. The heavier methods carry assumptions too. Agile frameworks such as Scrum, with short sprints, daily stand-up meetings, and velocity charts, were designed around full-time software teams working the same hours. They fit awkwardly onto part-time student work, volunteer open-source projects, and community-engaged research measured in semesters, so “let’s do Agile” is a claim about what kind of work counts, not just a scheduling choice.
See Chapter 8 for the broader framework. The concrete prompt to carry forward: when you adopt a project-management practice, ask whose work it makes legible and whose work it lets disappear.
30.10 Worked examples
These follow one small course project, coffee-sales: which products drove the spring sales increase at three campus cafés? The commands and output are from a real run in September 2026 (Python 3.11, pandas 3.0, on Linux; on Windows, activate the environment with .venv\Scripts\activate).
Start a new course project in 20 minutes
Make the folders from the template above, start Git, and create the environment before you write any analysis:
$ mkdir -p coffee-sales/{data/raw,data/processed,notebooks,src,reports/figures}
$ cd coffee-sales
$ git init
$ python -m venv .venv
$ source .venv/bin/activate
$ pip install -r requirements.txt
Before that last line, write three short files. requirements.txt holds the one package the project needs so far, pinned: pandas==3.0.6. .gitignore keeps out what shouldn’t be committed: .venv/, __pycache__/, .ipynb_checkpoints/, and the generated data/processed/ and reports/. And the README states the question, then how to set up and run the project, even though “run” is only one line so far (Template B below has the full skeleton). Then commit:
$ git add .
$ git commit -m "Set up project structure"
[main (root-commit) d010a71] Set up project structure
 4 files changed, 19 insertions(+)
 create mode 100644 .gitignore
 create mode 100644 README.md
 create mode 100644 data/raw/.gitkeep
 create mode 100644 requirements.txt
(If your first line says master rather than main, your Git is using the old default branch name; Chapter 31 shows the one-time setting that changes it.) Notice what isn’t in the commit: notebooks/, src/, and the other empty folders. Git tracks files, not folders, so an empty folder simply doesn’t exist in anyone else’s clone. An empty placeholder file named .gitkeep keeps a folder that has to exist (here data/raw/, where the data will go); the others will fill up with real files soon enough.
Intake a dataset with provenance and a data dictionary
The cafés’ sales export arrives as a CSV. Put it in data/raw/ and don’t edit it. Record where it came from in data/raw/provenance.md (see “Provenance” above), and record its checksum so you can tell later if the file ever changes:
$ sha256sum data/raw/sales-2026-04-10.csv >> data/raw/checksums.txt(On macOS the command is shasum -a 256.) Then run a first-pass quality report, a few lines that say what the file contains before you trust it:
import pandas as pd

df = pd.read_csv("data/raw/sales-2026-04-10.csv")
print(f"{len(df)} rows, {df.shape[1]} columns")
print(f"duplicate rows: {df.duplicated().sum()}")
print("missing values per column:")
print(df.isna().sum().to_string())
$ python src/quality_report.py
10 rows, 6 columns
duplicate rows: 1
missing values per column:
date 0
store 0
product 0
quantity 1
revenue 0
note 7Read it column by column. Seven missing note values are expected: the data dictionary says a blank note means no discount. One missing quantity and one duplicated row are not expected, and each needs a decision. Draft the data dictionary now, following “Data dictionary and codebook” above, while the columns are fresh in your mind.
Use issues to manage a cleaning pipeline
Each surprise in the quality report becomes an issue, with a definition of done:
- “Decide what to do with the duplicate sale (south, coffee, 2026-04-02).” Done when you know whether it’s one sale recorded twice or two identical sales (ask whoever sent the export), and the cleaning script does the right thing.
- “Handle the sale with a missing quantity (north, tea, 2026-04-03).” Done when the row is either filled in from another source or dropped, and the choice is written in the README’s list of cleaning rules.
- “Draft the data dictionary.” Done when every column has a description, units, and allowed values.
Close each issue with a sentence that says what you decided, and link the commit or output that shows it: “One sale recorded twice, confirmed by the café manager; clean.py now drops exact duplicates (commit 4e1a0c2).” Three months later, those closing notes are the only record of why the processed data has 8 rows, not 10.
Final reproducibility check before submission
The day before the deadline, run the check from “The reproducibility check” above: throw away everything generated, rebuild from the README, and run. For this project, it caught a real problem:
$ rm -rf .venv data/processed/*
$ python -m venv .venv
$ source .venv/bin/activate
$ pip install -r requirements.txt
$ python src/clean.py
...
ImportError: Unable to find a usable engine; tried using: 'pyarrow', 'fastparquet'.
A suitable version of pyarrow or fastparquet is required for parquet support.
Trying to import the above resulted in these errors:
 - `Import pyarrow` failed. pyarrow is required for parquet support. Use pip or conda to install the pyarrow package.
 - `Import fastparquet` failed. fastparquet is required for parquet support. Use pip or conda to install the fastparquet package.
clean.py writes Parquet, which pandas can’t do without the pyarrow package (or fastparquet). It had worked for weeks, because pyarrow was installed by hand in the old environment, but it was never added to requirements.txt, so anyone else following the README would have hit this error. Add it, pinned to the version you used, and rebuild:
$ echo "pyarrow==25.0.1" >> requirements.txt
$ pip install -r requirements.txt
$ python src/clean.py
wrote 8 rows to data/processed/sales.parquet
$ sha256sum -c data/raw/checksums.txt
data/raw/sales-2026-04-10.csv: OK
$ git status --short
 M requirements.txt
The pipeline runs from nothing, the raw data is unchanged, and the only difference from the last commit is the fix. Commit it.
The strictest version of the check starts from a fresh clone in a new folder, because that also catches anything that exists only on your computer. Here it caught a second problem:
$ git clone coffee-sales fresh
Cloning into 'fresh'...
done.
$ cd fresh
$ python -m venv .venv
$ source .venv/bin/activate
$ pip install -r requirements.txt
$ python src/clean.py
...
OSError: Cannot save file into a non-existent directory: 'data/processed'
.gitignore keeps data/processed/ out of the repository, and Git doesn’t track empty folders, so a fresh clone has no such folder. On the original computer it had always existed. The fix is one line in clean.py, before it writes, so the script makes the folder it needs: Path("data/processed").mkdir(parents=True, exist_ok=True) (with from pathlib import Path at the top). After that, the fresh clone runs cleanly: wrote 8 rows to data/processed/sales.parquet.
Neither check took long, and between them they found two problems the day before the deadline, not after it.
30.11 Templates
Template A: One-page project brief
Title:
Problem:
Audience:
Deliverables:
Success criteria:
Constraints:
Risks/unknowns:
Milestones:
Template B: README skeleton
# Project name

## Purpose

## Data

* Source:
* Retrieved:
* License/notes:
* Location: data/raw/

## Setup

* Create environment:
* Activate environment:

## Run

* Command(s) to reproduce key outputs:

## Outputs

* reports/
* figures/

## Notes

* Decisions and limitations
Template C: Issue template (student version)
Save this as an issue template and GitHub will offer it every time someone opens an issue:
Title:
Type: bug/task/question
Context:
What I tried:
Evidence (errors, screenshots, links):
Definition of done:
30.12 Exercises
Create a new project folder from the template and write a README that someone else could follow. Hand it to a classmate and watch, without helping, while they try.
Intake a dataset: put it in
data/raw/, write provenance notes, and draft a data dictionary. Generate the draft with pandas, fill in the descriptions by hand, then adaptcheck_data.pyfrom “Data dictionary and codebook” and confirm it passes. Change one value in a copy of the file and confirm it fails. For a stretch, make it check themissingcolumn too.Create five issues that break the project into milestones and tasks, each with a definition of done; label and prioritize them.
Do one task and close its issue with a short “what changed” note that links the commit.
Run a reproducibility check: delete everything generated, recreate your environment from the README, and rerun the pipeline. Then do it again from a fresh clone. Write down anything that broke.
30.13 One-page checklist
- I have a one-page brief with a clear goal and a definition of done.
- My project folder follows a layout where every kind of file has a home.
- Raw data is never edited, and its provenance and checksum are recorded.
- I keep a data dictionary, and new data is checked against it before I use it.
- Decisions that change the results are written down, in one agreed place.
- My README explains setup, the one command to run, and where the outputs are.
- Work is tracked in issues with clear titles, labels, and closing notes.
- I can reproduce my results from a fresh clone and a fresh environment.
30.14 Quick reference: “minimum viable” project operations
- Create the structure:
mkdir -p data/raw data/processed notebooks src reports/figures - Write the README: what it does, data, setup, one run command, outputs.
- Record the environment: a pinned
requirements.txt(orenvironment.yml), committed. - Intake data:
provenance.md, plussha256sum <file> >> data/raw/checksums.txt. - Draft a data dictionary from the data; check every new snapshot against it.
- Track work in issues: title, context, definition of done, labels.
- Reproduce end to end before delivery: fresh clone, fresh environment, one command.
- The Turing Way, Guide for Reproducible Research — a community-maintained handbook covering project structure, data management, and reproducibility; the closest thing to a full-length companion to this chapter.
- DrivenData, Cookiecutter Data Science — an opinionated project-layout template widely used in data science; worth reading as a reference even if you never run the generator.
- Greg Wilson et al., Good Enough Practices in Scientific Computing — a practical checklist for small-team reproducibility, and the model for this chapter’s “minimum viable” approach.
- Kieran Healy, The Plain Person’s Guide to Plain Text Social Science — a free book on running social-science projects with plain-text tools; especially good on bringing writing, data, and version control together.
- Atlassian, Agile Coach — a software vendor’s free guide to Scrum, Kanban, and the rest of the Agile vocabulary; useful for translating between this chapter and the language teams use in industry.
- Kent Beck et al., Manifesto for Agile Software Development — the short 2001 statement by seventeen software developers that started the Agile movement; useful background for the “Stakes and politics” section above.
- Cal Newport, Slow Productivity — a counterweight to sprint-and-velocity culture, for when project-management habits start squeezing out slow, careful work.
Comments and docstrings: say why
Comments and docstrings capture what the code can’t say for itself. The code already says what it does; your job is to say why.
A good docstring tells the reader what a function is for, what goes in and comes out, and what it assumes. Python’s conventions are in PEP 257, and many data projects use the NumPy layout shown here:
A good inline comment explains what isn’t obvious, and matches what the code does:
A bad comment just restates the code:
The rule of thumb: a comment that would make sense starting with “because” is worth writing; the code translated into English isn’t. And when you change the code, change the comment, because one describing code that’s gone is worse than none.